
Remote Provisioning and Management for Edge Networks
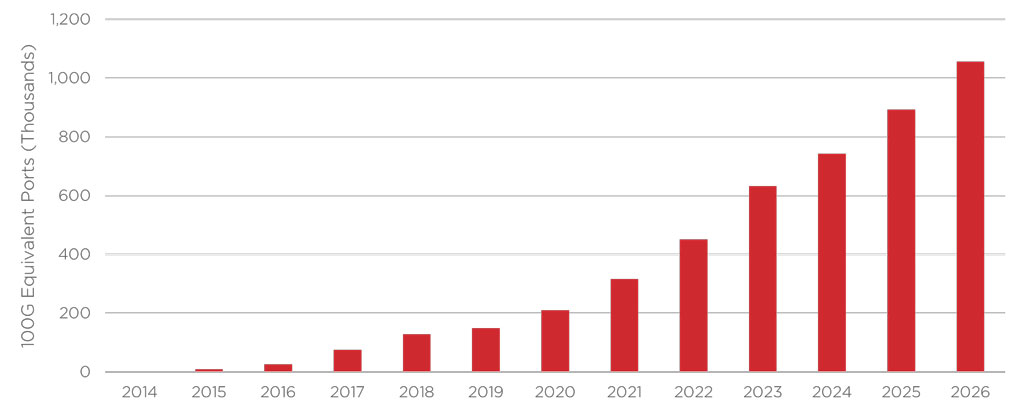
Smaller data centers near the end user can reduce latency, overcome inconsistencies in connectivity, and store and compute data closer to the end user. According to PricewaterhouseCoopers, these advantages will drive the worldwide market for edge data centers to more than triple from $4 billion in 2017 to $13.5 billion in 2024. With the increased use of edge computing, more high-speed transceivers are required to link edge data centers. According to Cignal AI, the number of 100G equivalent ports sold for edge applications will double between 2022 and 2025, as indicated in the graph below.
The increase in edge infrastructure comes with many network provisioning and management challenges. While typical data centers were built in centralized and controlled environments, edge deployments will live in remote and uncontrolled environments because they need to be close to where the data is generated. For example, edge infrastructure could be a server plugged into the middle of a busy factory floor to collect data more quickly from their equipment sensors.
This increase in edge infrastructure will provide plenty of headaches to network operators who also need to scale up their networks to handle the increased bandwidths and numbers of connections. More truck rolls must be done to update more equipment, and this option won’t scale cost-effectively, which is why many companies simply prefer not to upgrade and modernize their infrastructure.
Towards Zero-Touch Provisioning
A zero-touch provisioning model would represent a major shift in an operator’s ability to upgrade their network equipment. The network administrator could automate the configuration and provisioning of each unit from their central office, ship the units to each remote site, and the personnel in that site (who don’t need any technical experience!) just need to power up the unit. After turning them on, they could be further provisioned, managed, and monitored by experts anywhere in the world.
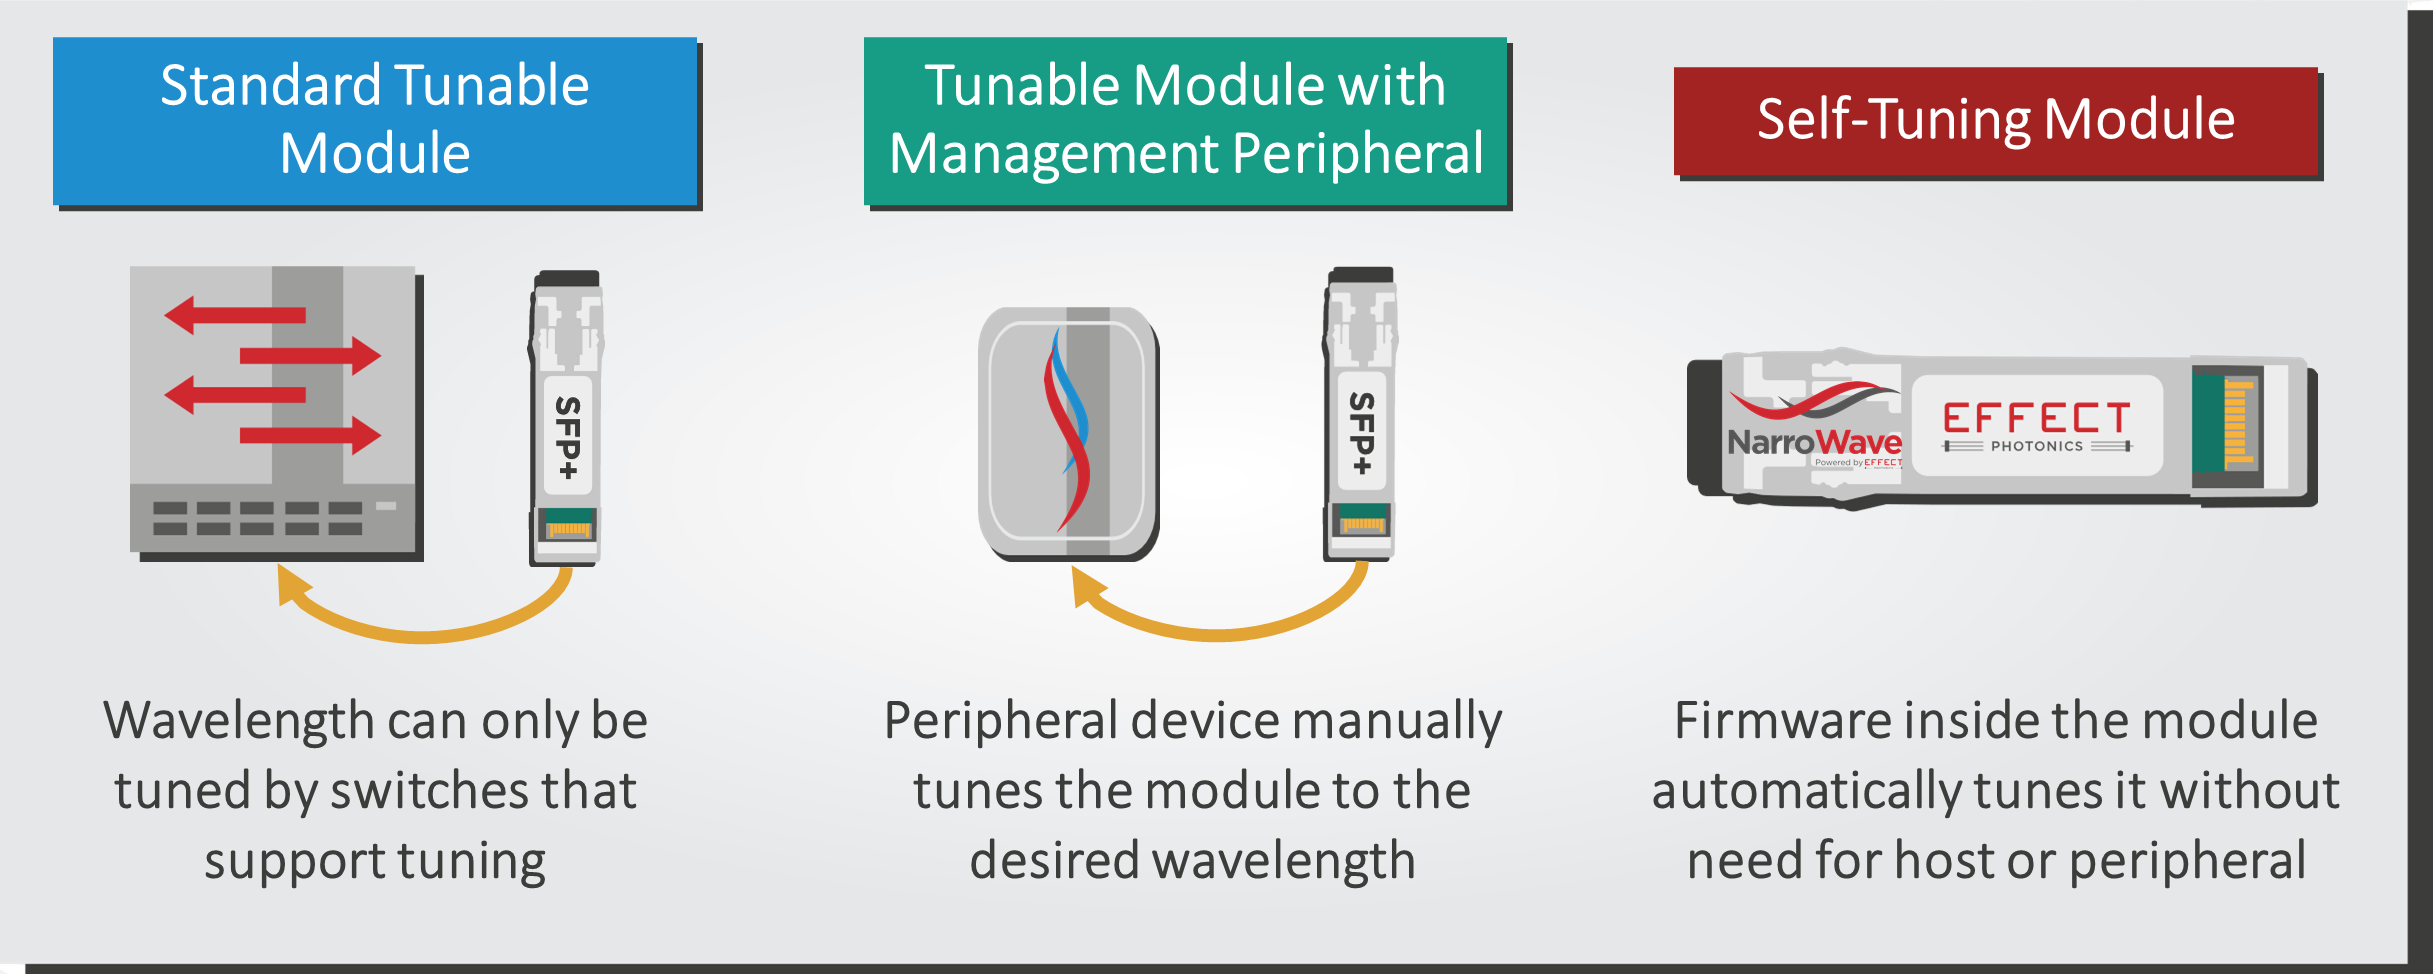
The optical transceivers potentially connected to some of these edge nodes already have the tools to be part of such a zero-touch provisioning paradigm. Many transceivers have a plug-and-play operation that does not require an expert on the remote site. For example, the central office can already program and determine specific parameters of the optical link, such as temperature, wavelength drift, dispersion, or signal-to-noise ratio, or even what specific wavelength to use. The latter wavelength self-tuning application is shown in Figure 2.
Once plugged in, the transceiver will set the operational parameters as programmed and communicate with the central office for confirmation. These provisioning options make deployment much easier for network operators.
Enabling Remote Diagnostics and Management
The same channel that establishes parameters remotely during the provisioning phase can also perform monitoring and diagnostics afterward. The headend module in the central office could remotely modify certain aspects of the tail-end module in the remote site, effectively enabling several remote management and diagnostics options. The figure below provides a visualization of such a scenario.
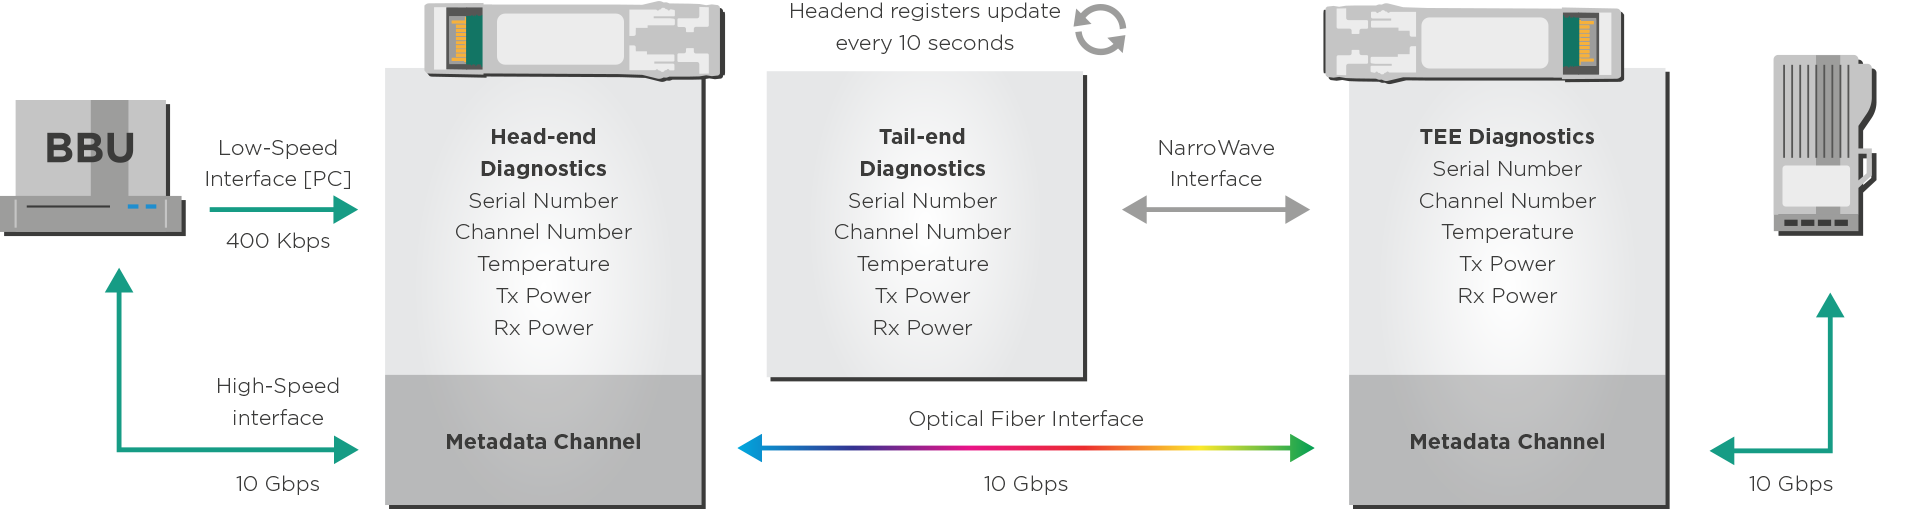
The central office can remotely measure metrics such as the transceiver temperature and power transmitted and received. These metrics can provide a quick and useful health check of the link. The headend module can also remotely read alarms for low/high values of these metrics.
These remote diagnostics and management features can eliminate certain truck rolls and save more operational expenses. They are especially convenient when dealing with very remote and hard-to-reach sites (e.g., an antenna tower) that require expensive truck rolls.
Remote Diagnostics and Control for Energy Sustainability
To talk about the impact of remote control on energy sustainability, we first must review the concept of performance margins. This number is a vital measure of received signal quality. It determines how much room there is for the signal to degrade without impacting the error-free operation of the optical link.
In the past, network designers played it safe, maintaining large margins to ensure a robust network operation in different conditions. However, these higher margins usually require higher transmitter power and power consumption. Network management software can use the remote diagnostics provided by this new generation of transceivers to develop tighter, more accurate optical link budgets in real time that require lower residual margins. This could lower the required transceiver powers and save valuable energy.
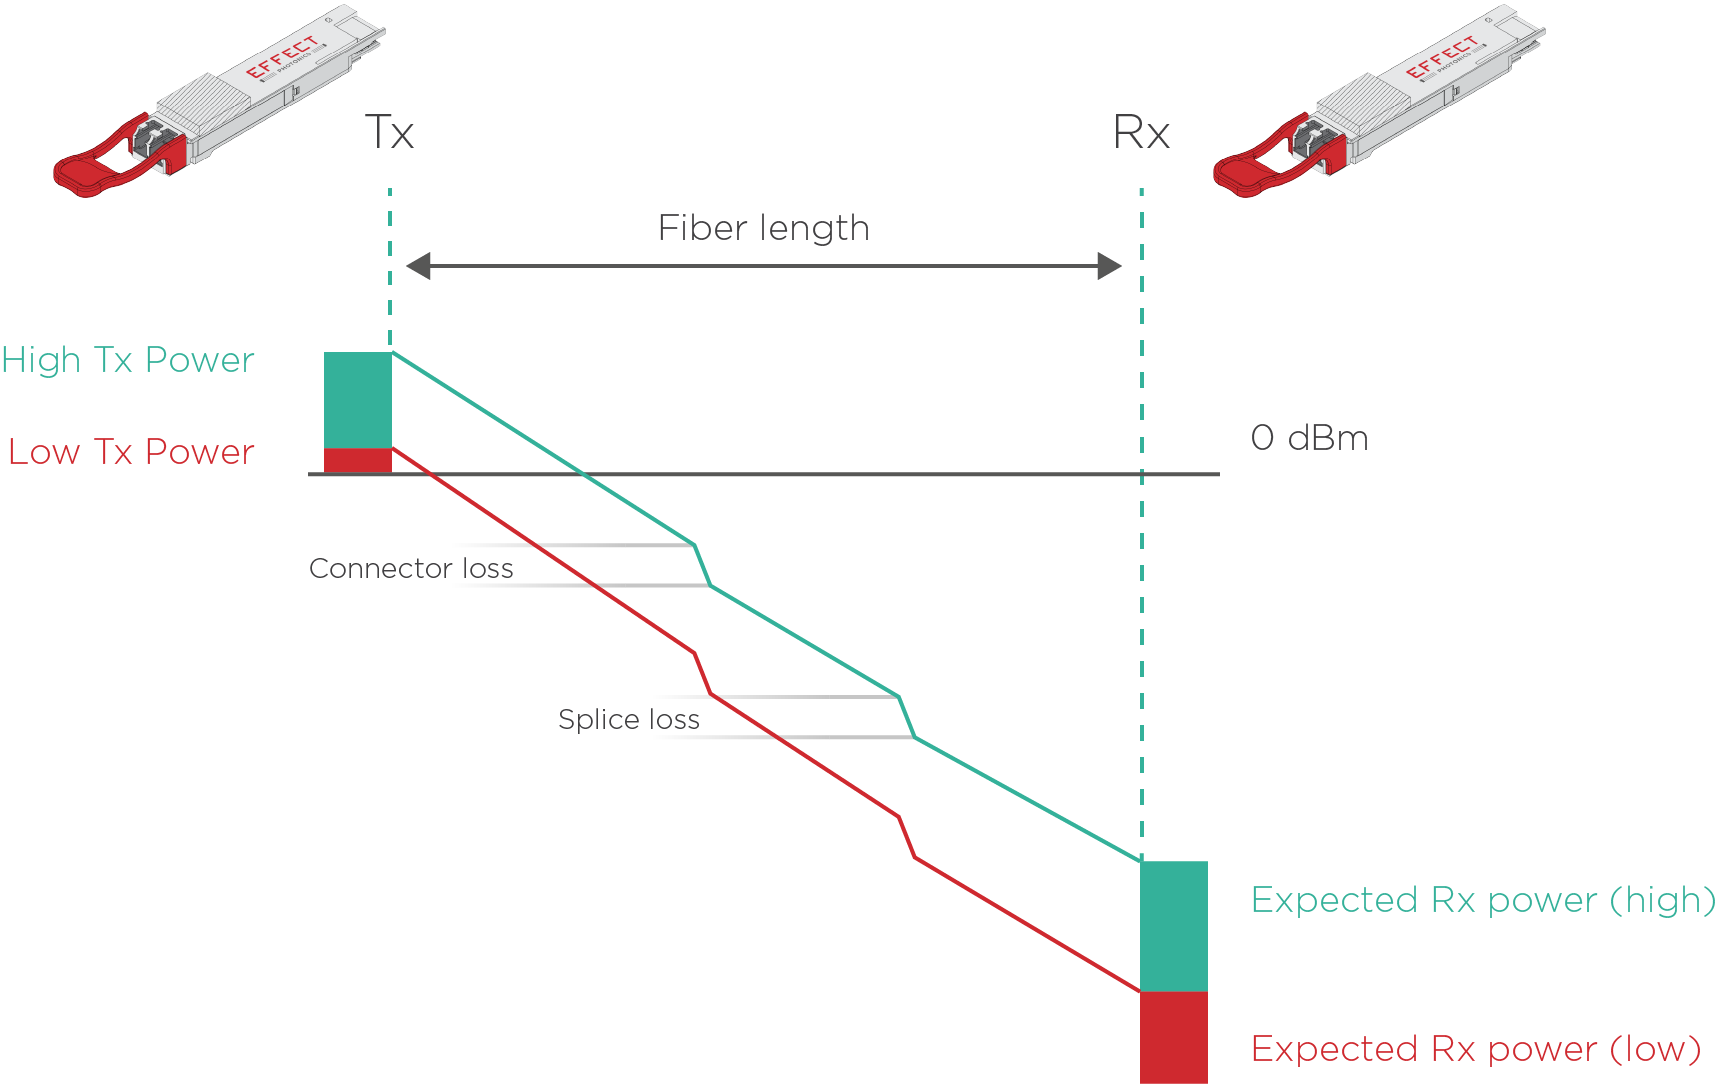
Another related sustainability feature is deciding whether to operate on low- or high-power mode depending on the optical link budget and fiber length. For example, if the transceiver needs to operate at its maximum capacity, a programmable interface can be controlled remotely to set the amplifiers at their maximum power. However, if the operator uses the transceiver for just half of the maximum capacity, the transceiver can operate with a smaller residual margin and use lower power on the amplifier. The transceiver uses energy more efficiently and sustainably by adapting to these circumstances.
If the industry wants interoperability between different transceiver vendors, these kinds of power parameters for remote management and control should also be standardized.
Takeaways
As edge networks get bigger and more complex, network operators and designers need more knobs and degrees of freedom to optimize network architecture and performance and thus scale networks cost-effectively.
The new generation of transceivers has the tools for remote provisioning, management, and control, which gives optical networks more degrees of freedom for optimization and reduces the need for expensive truck rolls. These benefits make edge networks simpler, more affordable, and more sustainable to build and operate.